Christine Esposito, Associate Editor05.22.12
This is HAPPI’s third annual R&D Salary Survey—in which we poll research and development personnel to determine their attitudes toward their jobs, salaries and what the biggest concerns are at work. Our survey was conducted online in April 2012, and more than 800 people took part.
Nearly 12% of respondents said they had changed companies in the past year, up from 7.5% in 2011.
Mars v. Venus

The Compensation Situation
In our poll, 37.4% of the chemists in our survey said they did not receive a raise.
A special thanks to all who participated— including the winners of our Apple iPad giveaway and a free registration to Happi’s 1St Annual Anti-Aging Conference & Tabletop Exhibition, which will be held Sept. 18-19, 2012.
We’re looking forward to including more of you in our 2013 R&D Salary Survey—and if there’s something you’d like for us to query your peers about, please let tell us. Maybe we’ll add your topic next time around.
Who You Are
Our respondents came from manufacturers of personal care/beauty products, household products and industrial and institutional cleaning products (I&I) as well as the suppliers that provide them with raw materials they need to craft their wares and other service providers, such as testing firms.
By category, 65% of the respondents came from finished goods manufacturers, 24% were in the “supplier” category and 11% labeled their companies as “other” which included lab service provider, consultants, etc.
Of those surveyed, 77% work in the personal care/beauty sector, 16% in household products and 7% in I&I.
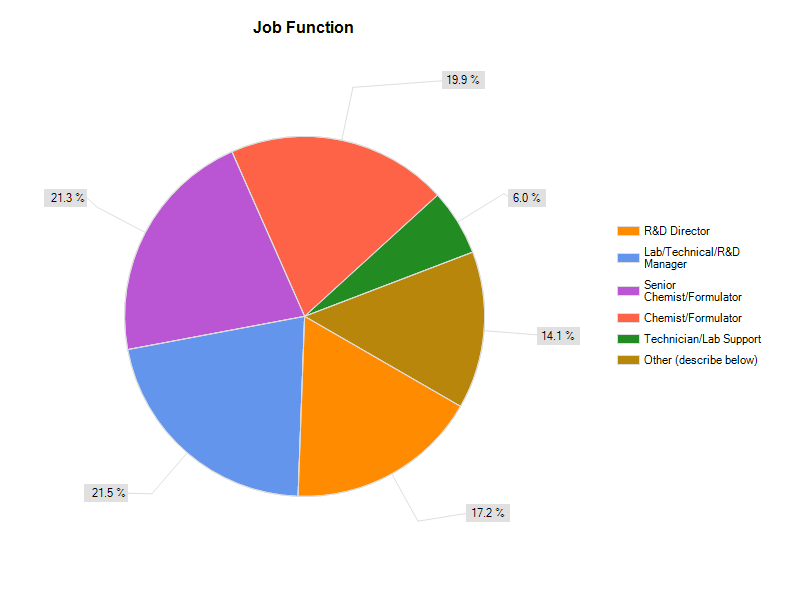
Respondents included R&D directors (17.2%), lab/technical/R&D managers (21.5%), senior chemists (21.3%), chemists/formulators (19.9%), technician/lab support (6.0%) and other (14.1%), which included titles such as quality and development director, consumer affairs staff and regulatory specialists. By gender, the group was once again rather evenly split— 50.3% of respondents were men and 49.7% women.
The median age of our respondents was 45, with the oldest respondent 84 years young. The median years of experience in the industry was 17.
Regarding education, 27.0% of the respondents have Master’s degrees, 48.5% obtained Bachelor’s degrees; 15.1% have Doctorate level education, 4.7% had earned their high school diploma and 4.7% checked “other.”
The majority of respondents (74.7%) came from the US, 10.2% came from Asia-Pacific, 6.8% came from Europe, 2.1% from Latin/South America, 2.7% from Canada, 1.3% from Mexico and 1.3% from Middle East/Africa. “Other” was the response of 0.9%.
What’s in Your Wallet?
Here is a look at the median salary levels for US-based respondents based on the position they hold. More detailed breakdowns—including compensation levels for other geographic regions, gender comparisons and salary differences at supplier vs. finished goods firms— are listed under the specific job title sections. All responses are in US dollars.
Median Annual Base Salary in the US (base salary data from 2011 survey)
Lab Technician—$46,000 ($43,000)
Chemist/Formulator—$58,000 ($58,000)
Senior Chemist—$85,000 ($83,000)
R&D Manager—$100,000 ($101,000)
R&D Director—$128,000 ($110,000)
Although a small percentage, more of our respondents reported being fired (3.5%) compared to just 2.5% in the 2011 pool.
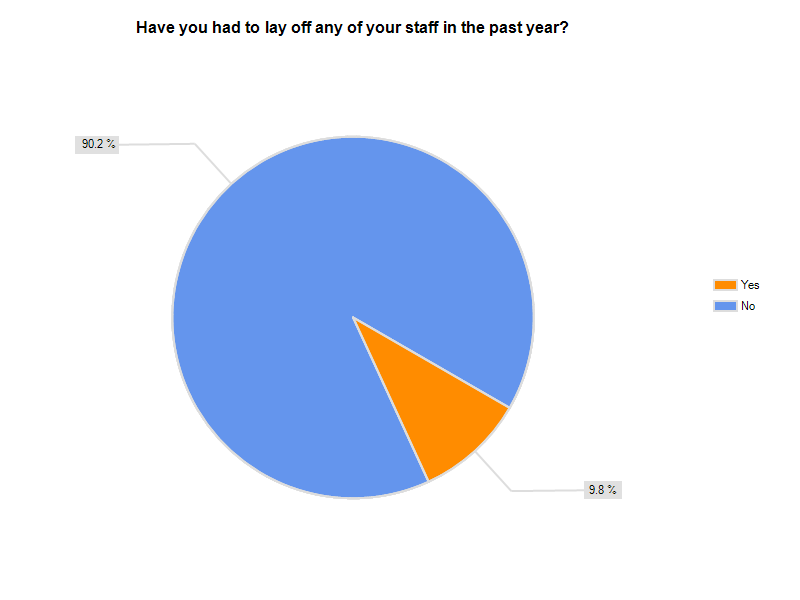
Our polled showed that nearly 10% had to lay off staff in the past year, down considerably from the 20.1% in our 2010.
Nearly 12% of respondents said they had changed companies in the past year, up from 7.5% in 2011.
In terms of raises, 63.1 % said they received a raise for 2011 (up from 58.7% the prior year). The vast majority of respondents—more than 95.1%—had not taken a cut in base salary in the past year, the same as last year. Some 13.5% said their company had stopped matching 401(k) contributions or cut other retirement-related benefits, up slightly from 13% in 2011.
What’s On Your Mind Most: Politics or Paychecks?
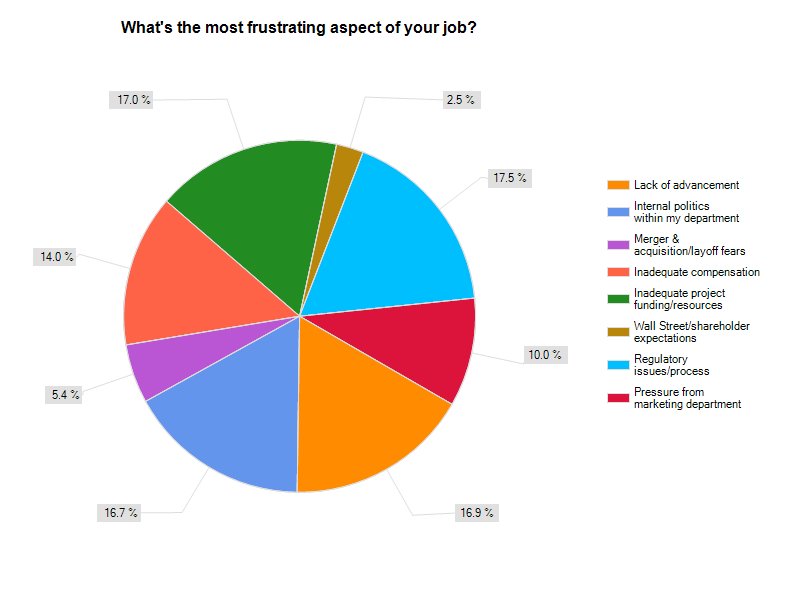
When asked what is the most frustrating aspect of your job, respondents’ answers varied, with several categories pulling in similar percentage. The top concerns included regulatory issues/process, inadequate project funding/resources, a lack of advancement, internal politics and inadequate compensation. You can see the chart for details.
Mars v. Venus
Even broken down by gender, there’s little difference when it comes to frustrations at work. For women the top four were inadequate project funding, regulatory pressures, lack of advancement and internal politics. For men, the top four were regulatory pressure, inadequate project funding, lack of advancement and politics.
Happy with that paycheck?
When it comes to how R&D staff feel about the compensation, 32.2% said they were “somewhat dissatisfied” when asked how satisfied they were that their present compensation reflected their level of responsibility. 28.7% answered “satisfied” and 8.4% said “very satisfied.” Less than 10% (9.3%) answered “very dissatisfied.”
Should I Stay or Should I Go?
Those issues aside, when asked how likely you are to leave your current company in the next two years, 31.6% said they were “not sure” and 24.2% said “unlikely.” 14.4% recorded responses of “likely.” Just shy of a quarter of our respondents (23%) said it was very unlikely that they would leave in the next two tears, while 6.8% said they were definitely leaving.
In terms of job security, when asked how secure your feel in your present position, the vast majority (57.9%) said they feel “secure” while another 26% said “very secure.” Thirteen percent selected “insecure” and 3.1% said they felt “very insecure.”
Some 12.7% of respondents felt that it was “unlikely” that their company would be acquired in the next 12 months. Only 8.4% felt it was “very likely” that their company would be involved in a merger or acquisition. Together, more than 41% said either “not sure” or “unlikely.”
More Budgets Keep Steady
According to our poll, 36.4% respondents said that their department had its budget cut in the past 12 months, down from 40% in 2011 and 44.8% in 2010.
The Compensation Situation
While the information above casts a wide net, here is a way to gauge your current compensation—and concerns—with that of your peers. Unless noted, the salary figures are for US. When applicable, we have included compensation levels for specific geographic regions as well as by gender, supplier vs. finished goods manufacturer and by industry (beauty/personal care vs. household products vs. I&I)—when survey data supported these responses. There are also results of leading job concerns/issues based on job function. Further, we have included data from our 2011 survey to use as a point of comparison. All data is in US dollars.
• Lab Technician (data from 2011 survey)
Median Annual Base Salary: $46,000 ($41,100)
Median Annual Base Salary for female: $45,000 ($40,000)
Median Annual Base Salary at finished goods company: $42,500 ($40,000)
Median Annual Base Salary at supplier: $52,000 ($47,100)
Median Annual Base Salary at “other” (lab service provider, consultant, etc.): $40,500 (n/a)
According to our poll, 31.5% of lab technicians did not receive a raise this year.
When asked what their biggest concerns were in the office, lack of advancement topped the list with lab/technician/support staffers at 44%, followed by 16% who claimed internal politics was their biggest issue. The next biggest concern (11%) was inadequate compensation.
•Chemist/Formulator
Median Annual Base Salary: $58,000 ($58,000)
Median Annual Base Salary female: $54,000 ($56,000)
Median Annual Base Salary at finished goods company: $55,500 ($58,000)
Median Annual Base Salary at finished goods company-beauty/personal care: $55,000 ($56,000)
Median Annual Base Salary at finished goods company-household: $62,300 ($70,000)
Median Annual Base Salary at finished goods-company I&I: $56,000 ($60,000)
Median Annual Base Salary at supplier: $61,000 ($58,000)
Median Annual Base Salary at “other” (lab service provider, consultant, etc.): $60,000 (n/a)
Median Annual Base Salary Asia-Pacific: $20,000 ($16,000)
Median Annual Base Salary Europe: $40,000 ($35,000)
Median Annual Base Salary Canada: $50,000 ($48,000)
In our poll, 37.4% of the chemists in our survey said they did not receive a raise.
For chemists/formulators, lack of advancement was the most cited job concern, with 18.5% of respondents naming it as the primary issue. Inadequate compensation and internal politics followed at 18.5% and 19.2%, respectively. Other responses included pressure from the marketing department at 7.8%, regulatory issues/processes at 10.7%, inadequate project funding at 15% and merger & acquisition/layoff fears at 9%. Wall Street/shareholder expectations were cited by less than one percent of respondents.
•Senior Chemist
Median Annual Base Salary: $85,000 ($83,000)
Median Annual Base Salary female: $80,000 ($79,700)
Median Annual Base Salary at finished goods: ($80,000)
Median Annual Base Salary at finished goods company-personal care/beauty: $85,000 ($75,500)
Median Annual Base Salary at finished goods company-household: $101,000 ($100,000)
Median Annual Base Salary at finished goods company-I&I: $80,000 ($73,000)
Median Annual Base Salary at supplier: $90,000 ($87,000)
Median Annual Base Salary at “other” (lab service provider, consultant, etc.): $58,500
Median Annual Base Salary Europe: $59,000 ($72,000)
Median Annual Base Salary Latin America: $59,000 ($39,500)
Median Annual Base Salary Canada: $61,000 ($63,000)
Of the senior chemists who took part in our poll, 32% did not receive a raise.
For senior chemists, the top job concern cited was lack of advancement (21.8%), followed by internal politics (17.9%). Next up were inadequate project funding (16%), pressure from the marketing department (12%) and regulatory issues at 10.9%. Inadequate compensation (7.6%) topped merger & acquisition/layoff fears (6%). Wall Street/shareholder expectations were cited by 3% of our senior chemists as their biggest concern.
•Lab/Technical/R&D Manager
Median Annual Base Salary: $100,000 ($101,000)
Median Annual Base Salary female: $100,000 ($94,000)
Median Annual Base Salary at finished goods company $98,900 ($100,500)
Median Annual Base Salary at finished goods company-personal care/beauty $100,000 ($106,000)
Median Annual Base Salary at finished goods company-household: $93,000 ($120,000)
Median Annual Base Salary at finished goods company-I&I: $69,000 ($80,000)
Median Annual Base Salary at supplier: $101,000 ($100,000)
Median Annual Base Salary Asia Pacific: $40,000 ($30,300)
Median Annual Base Salary Europe: $75,000 ($67,800)
Median Annual Base Salary Canada: $87,000 ($84,000)
Some 32.5% of lab managers in our poll did not receive a raise.
For lab managers, inadequate project funding (21.8%) was ranked as the top concern, with regulatory issues/concerns at 20.5%. Inadequate compensation (16.5%) and internal politics (12.5%) were next. Lack of advancement was the responses of 10.5%. Rounding it out were pressure from the marketing department (13.2%), merger & acquisition/layoff fears (3.3%) and Wall Street/shareholder expectations (1.3%).
• R&D Director
Median Annual Base Salary $128,000 ($110,000)
Median Annual Base Salary female: $140,000 ($100,000)
Median Annual Base Salary at finished goods company: $130,000 ($110,000)
Median Annual Base Salary at finished goods company-personal care/beauty: $131,000 ($125,000)
Median Annual Base Salary at finished goods company-household: $150,000 ($110,000)
Median Annual Base Salary at finished goods company-I&I: $105,000 ($100,000)
Median Annual Base Salary at supplier: $135,000 ($105,000)
Median Annual Base Salary at “other” (lab service provider, consultant, etc.): $97,500
Median Annual Base Salary Europe: $97,000 ($35,000)
Median Annual Base Salary Canada: $72,500 ($77,500)
In our poll, 37% of R&D directors did not receive a raise as reported in our survey.
The top job concern cited by R&D directors in this year’s poll was regulatory issues/processes at 28.4%. Inadequate project funding was 18.6% with lack of advancement and inadequate compensation each tallying 10.7% of the votes. Nearly 12% R&D polltakers cited internal politics as their hot button issue. Almost 10% cited pressure from the marketing department as their issue, while M&A/layoff fears and Wall Street concerns were each cited by 2.5%.
