
Paolo Giacomoni, PhD, Insight Analysis Consulting07.01.22
Statistics can help decide whether the difference between two outcomes is the consequence of random phenomena or really represents a difference. The way of thinking in statistics is: Let’s figure out what the outcome would be if everything happens randomly. Let’s then take a measurement and if the measurement differs from the expected random results, then the observed difference means that something more than just chance is at work.
The best example to illustrate this way of thinking is the story of the student who had two lovers and, being unable to choose between one or the other, decided to leave the choice to chance. The two loved ones lived at the opposite ends of a bus line and since the buses left the bus stop every 10 minutes in both directions, the decision was to go randomly at the bus stop and jump on the first bus. After 20 days, it turned out that the student went 16 times to the right and four times to the left. The student thought that such an outcome was a meaningful sign of the Almighty until a friend pointed out that the bus going to the left was leaving the bus stop at the hour, ten minutes after the hour, 20 minutes after the hour etc., whereas the bus going to the right was leaving the bus stop eight minutes after the hour, 18 minutes after the hour, etc., and therefore the result was perfectly random and the difference in the outcome was not “statistically” significative…and the student had to figure out something else to make the choice.
Statistics must be considered with a grain (or two) of salt.
When dealing with measurements on cohorts of individuals in skincare experiments, the individual variability adds to the difficulty of interpreting the results because it affects the average value as well as the standard deviation, both before and after the treatment. For instance, when measuring the effect of a treatment on skin hydration, trans epidermal water loss, skin reflectivity, skin elasticity or other cutaneous parameters, the panelists in the cohort have different values to begin with and can react differently to the treatment.
So, the question is: how can one use the data to point out the effect of a treatment (if any)?
In both cases such statistical analysis, far from proving an actual effect of the treatment, might lead to the masking of the efficacy of the treatment. As a matter of fact, the experimenters should not look at the data of the cohort as a whole: they should take into consideration the individual results and calculate the average change. When the individual variability is very large, then the experimenters can normalize the results and calculate the average of the percent change for every individual in the cohort.For this kind of clinical tests, the relevant measure is NOT the difference of the averages of the values for the cohort after and before the treatment, BUT the average of the differences observed for every participant in the cohort.
Figures 1 and 2 depict a fictive experimental result, where the values of the measured parameter are 6, 7, 8, 9, 10, 11, 12, 13 and 14 before the treatment and 8, 9, 10, 11, 12, 13, 14, 15 and 16 after the treatment.
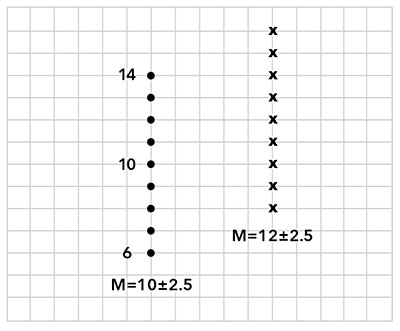
Figure 1. On the left, the results of a measurable parameter on 10 individuals, before the treatment. On the right, the results on the same 10 individuals, after treatment.
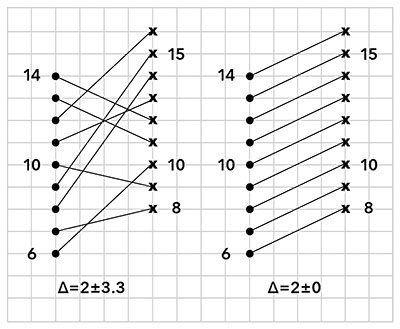
Figure 2. Results can be widely distributed (left panel) or characterized by a consistent change in the same direction for each and every individual in the cohort (right panel).
When one calculates the averages M(“before”) and M(“after”), as well as the Standard Deviation, one obtains M (before) = 10+/- 2.5 and M (after) = 12+/- 2.5
Since M(after) – M(Before) = 2 and the sum of the Standard Deviations is 5, one could confess that the difference is not significative and that the treatment is ineffective.
Let us consider the individual differences: Δ = “after” minus “before” The same set of results can be provoked by different changes after the treatment. Two extreme cases are given in the example of Figure 2: the results can be distributed all over the place (Figure 2, left panel) or can be characterized by a consistent change in the same direction for each and every individual in the cohort (Figure 2, right panel). In the first case the treatment appears to be totally useless, whereas in the second case the results of the treatment appear to be highly significative. On the left and on the right, the values of “before” and “after” for every panelist are joined by a segment. On the left, the average of the differences is Δ=2 and the SD=3.3.On the right, Δ=2 and SD = 0. When the outcome of the experiment is like the one depicted on the left, one can safely state that the treatment is ineffective. When the outcome is like the one depicted on the right, one can safely say that the treatment is effective because the average of the differences is highly statistically significative.
With large individual variabilities of the base line, of the response to treatment and of the skin during the time (often weeks) needed in a skincare treatment, the only way to assess the efficacy of a treatment is to analyze the individual variations. Statistical methods allow a rigorous treatment of these data when the average of the differences, NOT the difference of the averages, is taken into account.
Paolo Giacomoni, PhD
Insight Analysis Consulting
paologiac@gmail.com
516-769-6904
Paolo Giacomoni acts as an independent consultant to the skin care industry. He served as executive director of research at Estée Lauder and was head of the department of biology with L’Oréal. He has built a record of achievements through research on DNA damage and metabolic impairment induced by UV radiation as well as on the positive effects of vitamins and antioxidants. He has authored more than 100 peer-reviewed publications and has more than 20 patents.
The best example to illustrate this way of thinking is the story of the student who had two lovers and, being unable to choose between one or the other, decided to leave the choice to chance. The two loved ones lived at the opposite ends of a bus line and since the buses left the bus stop every 10 minutes in both directions, the decision was to go randomly at the bus stop and jump on the first bus. After 20 days, it turned out that the student went 16 times to the right and four times to the left. The student thought that such an outcome was a meaningful sign of the Almighty until a friend pointed out that the bus going to the left was leaving the bus stop at the hour, ten minutes after the hour, 20 minutes after the hour etc., whereas the bus going to the right was leaving the bus stop eight minutes after the hour, 18 minutes after the hour, etc., and therefore the result was perfectly random and the difference in the outcome was not “statistically” significative…and the student had to figure out something else to make the choice.
Statistics must be considered with a grain (or two) of salt.
Statistics in Skin Care
Generally speaking, statistics are “easily” applied when many measurements are made on one “object” and when one can assume that the random error affecting the measure is distributed on a gaussian curve (aka as a “bell” curve). The standard deviation SD is an indication of the “width” of the interval [(average + SD) – (average – SD)] in which fall about 70% of the measured values. The Standard Deviation is therefore an indicator of the accuracy of the measurement.When dealing with measurements on cohorts of individuals in skincare experiments, the individual variability adds to the difficulty of interpreting the results because it affects the average value as well as the standard deviation, both before and after the treatment. For instance, when measuring the effect of a treatment on skin hydration, trans epidermal water loss, skin reflectivity, skin elasticity or other cutaneous parameters, the panelists in the cohort have different values to begin with and can react differently to the treatment.
So, the question is: how can one use the data to point out the effect of a treatment (if any)?
How it Works...or Doesn’t
Often the experimenter calculates the average of the values and the standard deviation of the parameter (hydration, elasticity, etc.) for the cohort before the treatment and after the treatment and checks for the difference. Some experimenters consider that when the difference of the averages is less than the sum of the standard deviations, the results are not significatively different. Other experimenters, perhaps under pressure by marketing executives, invoke arkane algorithms to obtain a verdict of statistical significance.In both cases such statistical analysis, far from proving an actual effect of the treatment, might lead to the masking of the efficacy of the treatment. As a matter of fact, the experimenters should not look at the data of the cohort as a whole: they should take into consideration the individual results and calculate the average change. When the individual variability is very large, then the experimenters can normalize the results and calculate the average of the percent change for every individual in the cohort.For this kind of clinical tests, the relevant measure is NOT the difference of the averages of the values for the cohort after and before the treatment, BUT the average of the differences observed for every participant in the cohort.
Figures 1 and 2 depict a fictive experimental result, where the values of the measured parameter are 6, 7, 8, 9, 10, 11, 12, 13 and 14 before the treatment and 8, 9, 10, 11, 12, 13, 14, 15 and 16 after the treatment.
Figure 1. On the left, the results of a measurable parameter on 10 individuals, before the treatment. On the right, the results on the same 10 individuals, after treatment.
Figure 2. Results can be widely distributed (left panel) or characterized by a consistent change in the same direction for each and every individual in the cohort (right panel).
Since M(after) – M(Before) = 2 and the sum of the Standard Deviations is 5, one could confess that the difference is not significative and that the treatment is ineffective.
Let us consider the individual differences: Δ = “after” minus “before” The same set of results can be provoked by different changes after the treatment. Two extreme cases are given in the example of Figure 2: the results can be distributed all over the place (Figure 2, left panel) or can be characterized by a consistent change in the same direction for each and every individual in the cohort (Figure 2, right panel). In the first case the treatment appears to be totally useless, whereas in the second case the results of the treatment appear to be highly significative. On the left and on the right, the values of “before” and “after” for every panelist are joined by a segment. On the left, the average of the differences is Δ=2 and the SD=3.3.On the right, Δ=2 and SD = 0. When the outcome of the experiment is like the one depicted on the left, one can safely state that the treatment is ineffective. When the outcome is like the one depicted on the right, one can safely say that the treatment is effective because the average of the differences is highly statistically significative.
Is It Truly Significant?
Statistically significant results may be totally irrelevant. Consider the paradoxical example of the treatment that provokes the growth of exactly two extra hair per square centimeter on the scalp of a large number of volunteers: the result can be statistically significant, and yet, as far as hair growth is concerned, it is totally irrelevant. In this case the use of statistics embellishes the results and allows the claim: this lotion increases the growth of hair in a statistically significant manner. In other cases, as the ones discussed above, the application of statistical methods without a critical analysis of the experiment might lead to discarding results that are indeed highly significative in experiments that show a relevant effect of the treatment.With large individual variabilities of the base line, of the response to treatment and of the skin during the time (often weeks) needed in a skincare treatment, the only way to assess the efficacy of a treatment is to analyze the individual variations. Statistical methods allow a rigorous treatment of these data when the average of the differences, NOT the difference of the averages, is taken into account.
Paolo Giacomoni, PhD
Insight Analysis Consulting
paologiac@gmail.com
516-769-6904
Paolo Giacomoni acts as an independent consultant to the skin care industry. He served as executive director of research at Estée Lauder and was head of the department of biology with L’Oréal. He has built a record of achievements through research on DNA damage and metabolic impairment induced by UV radiation as well as on the positive effects of vitamins and antioxidants. He has authored more than 100 peer-reviewed publications and has more than 20 patents.
