04.13.16
Store brands sales reached $118.4 billion in 2015, an all-time record at an increase of $2.2 billion over the previous year. In the past two years alone, annual sales are up 5%, or $5.4 billion, in the major retail channels, according to PLMA’s 2016 Private Label Yearbook.
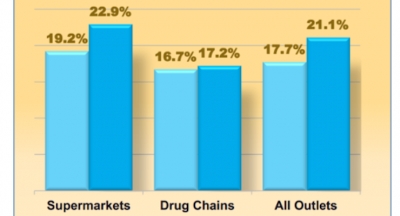
Store brands dollar share came to 17.7%, also the highest mark ever. Across all outlets combined store brands sales grew 2%, a performance that equaled that of national brands, which also rose 2%.
In unit sales, both store brands and national brands were off fractionally, less than a half percentage point each. Unit sales of store brands were almost 44 billion, nominally on par with last year. As a result, store brand unit share held at 21.1%.
The PLMA Private Label Yearbook compiles sales data provided by Nielsen for the 52 weeks ending Dec. 26, 2015. The industry annual is published online at
www.AskPLMA.com and has become the benchmarking standard for retailers and suppliers. Nielsen sales and market share statistics are reported for more than 700 food and nonfood product categories.
Even that total does not take into consideration store brand products sold by chains specializing in personal care and other goods. These are just a few of the non-grocery retail channels that are marketing a growing variety of store brand items.
Store brands continue to represent outstanding value for consumers. Shoppers could save an estimated $44 billion a year by buying store brand products over national brands, according to a study by the National Bureau of Economic Research, while market basket research by PLMA consistently reveals that shoppers can save about one-third on a basic food and household items in a typical supermarket by opting for the store brand over national brands.